Seasonal sales patterns that optimise inventory
We map peaks, slow periods, and product clusters so you can stock with confidence instead of reacting after the shelves are already wrong.
Trend lift
Stock timing
Margin guardrails
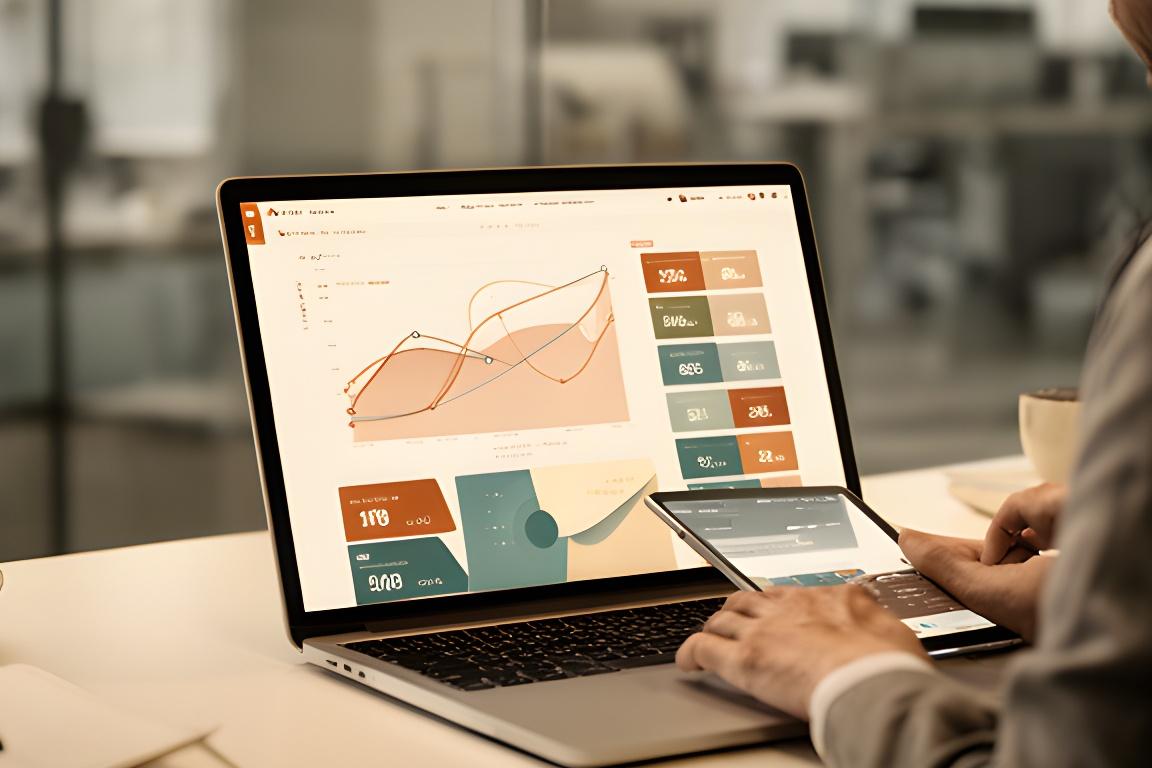
Your database holds a goldmine of insights, but only if you know where to dig. We turn raw numbers into the story behind your growth, with plain-English reporting that busy leaders can actually use. Why keep guessing when the answers are already in your data?
What we uncover
Seasonality, churn signals, margin leaks, and operational bottlenecks — what would your numbers reveal if someone asked the right questions?
We map peaks, slow periods, and product clusters so you can stock with confidence instead of reacting after the shelves are already wrong.
Which behaviours usually show up before a customer disappears? We build the answer into your reporting so the warning lights come on sooner.
From hand-offs to hidden delays, we trace the process path and show where time, money, and patience are leaking away.
Sometimes the biggest losses hide inside the busiest categories. We surface the outliers, explain why they matter, and point to the next decision.
Our analysis framework
We keep the process practical. You bring the business question; we bring the SQL, the cleaning discipline, and the reporting structure that turns a pile of rows into decision support. Sounds simple? It is — when the method is right.
We start with the decision you need to make, not a random chart.
Clean inputs, confirm totals, and close gaps before analysis begins.
You get a readable story, then tracking so the gains don’t vanish.
What changes if you can trust the numbers on Monday morning?
Case study
Before the analysis, product-level profitability was a blind spot. After the data was cleaned and reworked, the picture changed fast.
No visibility into which SKUs were quietly draining profit.
We found 15% of SKUs generating 80% of losses, with clear pricing and mix issues.
A re-pricing and discontinuation plan delivered an 18% margin lift in three months.
KPI analysis
Could the same approach uncover pricing gaps, slow movers, or a hidden break-even problem in your own business? That’s usually where the next win lives.
Tools and delivery
Clean tables, models, and summaries your team can use immediately.
Dashboards that show the right detail without overwhelming the page.
SQL Server, MySQL, PostgreSQL, and other reporting foundations.
PDF briefings, cloud dashboards, and automated email updates.
Leadership voices
“We finally understood which products were paying the rent. The report was clear, fast, and surprisingly practical.”
“Our dashboards changed the conversation in every management meeting. We’re making decisions with confidence instead of hunches.”
“Why did we choose Alex's Advanced Query? Because they explained the risks in plain English and showed us the quickest path to action.”
Ready to move forward?
Book a no-obligation data discovery session and we’ll show you the decisions sitting inside your database. Want a clearer forecast, better margins, and less guesswork? Let’s start there.